
Page 9 - June-Month
P. 9
TECHNICAL PAPER
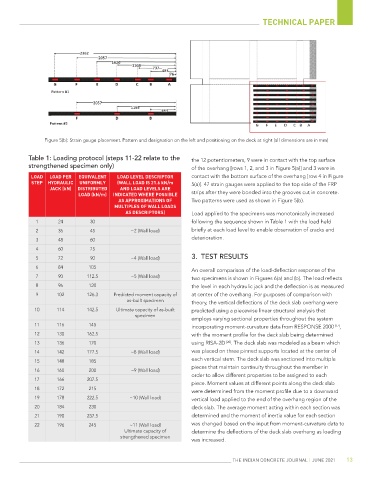
Figure 5(b): Strain gauge placement. Pattern and designation on the left and positioning on the deck at right (all dimensions are in mm)
Table 1: Loading protocol (steps 11-22 relate to the the 12 potentiometers, 9 were in contact with the top surface
strengthened specimen only) of the overhang [rows 1, 2, and 3 in Figure 5(a)] and 3 were in
LOAD LOAD PER EQUIVALENT LOAD LEVEL DESCRIPTOR contact with the bottom surface of the overhang [row 4 in Figure
STEP HYDRAULIC UNIFORMLY (WALL LOAD IS 21.6 kN/m 5(a)]. 47 strain gauges were applied to the top side of the FRP
JACK (kN) DISTRIBUTED AND LOAD LEVELS ARE
LOAD (kN/m) INDICATED WHERE POSSIBLE strips after they were bonded into the grooves cut in concrete.
AS APPROXIMATIONS OF Two patterns were used as shown in Figure 5(b).
MULTIPLES OF WALL LOADS
AS DESCRIPTORS) Load applied to the specimens was monotonically increased
1 24 30 following the sequence shown in Table 1 with the load held
2 36 45 ~2 (Wall load) briefly at each load level to enable observation of cracks and
3 48 60 deterioration.
4 60 75
5 72 90 ~4 (Wall load) 3. TEST RESULTS
6 84 105
An overall comparison of the load-deflection response of the
7 90 112.5 ~5 (Wall load) two specimens is shown in Figures 6(a) and (b). The load reflects
8 96 120 the level in each hydraulic jack and the deflection is as measured
9 102 126.3 Predicted moment capacity of at center of the overhang. For purposes of comparison with
as-built specimen theory, the vertical deflections of the deck slab overhang were
10 114 142.5 Ultimate capacity of as-built predicted using a piecewise linear structural analysis that
specimen
employs varying sectional properties throughout the system
11 116 145 incorporating moment-curvature data from RESPONSE 2000 [17] ,
12 130 162.5 with the moment profile for the deck slab being determined
13 136 170 using RISA-2D [20] . The deck slab was modeled as a beam which
14 142 177.5 ~8 (Wall load) was placed on three pinned supports located at the center of
each vertical stem. The deck slab was sectioned into multiple
15 148 185
pieces that maintain continuity throughout the member in
16 160 200 ~9 (Wall load)
order to allow different properties to be assigned to each
17 166 207.5
piece. Moment values at different points along the deck slab
18 172 215
were determined from the moment profile due to a downward
19 178 222.5 ~10 (Wall load) vertical load applied to the end of the overhang region of the
20 184 230 deck slab. The average moment acting within each section was
21 190 237.5 determined and the moment of inertia value for each section
22 196 245 ~11 (Wall load) was changed based on the input from moment-curvature data to
Ultimate capacity of determine the deflections of the deck slab overhang as loading
strengthened specimen
was increased.
THE INDIAN CONCRETE JOURNAL | JUNE 2021 13