
Page 11 - June-2022
P. 11
TECHNICAL PAPER
that high-strength steel of yield strength up to 600 MPa could cracks. The first flexural crack in the specimen L550-ST500 with
be used as the transverse reinforcements in the beams with M50 grade of concrete was noted at 180 kN load level (i.e.,
high concrete compressive strength and reinforced with high- shear force = 90 kN). The other two Set-II specimens exhibited
strength longitudinal steel without violating the serviceability the first flexural crack earlier than the specimen L500-ST500. The
corresponding load levels in the specimens L550-ST550 and
requirements related to the width of diagonal shear cracks.
L550-ST600 were observed as 150 kN and 120 kN. The difference
in the cracking loads was primarily because of the increased
4.4 Cracking pattern shear span ratios in the beams which resulted in the relatively
flexure-dominated behavior and thus, required a smaller load
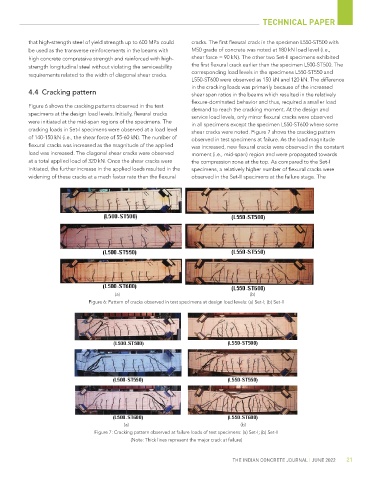
Figure 6 shows the cracking patterns observed in the test demand to reach the cracking moment. At the design and
specimens at the design load levels. Initially, flexural cracks service load levels, only minor flexural cracks were observed
were initiated at the mid-span regions of the specimens. The in all specimens except the specimen L550-ST600 where some
cracking loads in Set-I specimens were observed at a load level shear cracks were noted. Figure 7 shows the cracking pattern
of 140-150 kN (i.e., the shear force of 55-60 kN). The number of observed in test specimens at failure. As the load magnitude
flexural cracks was increased as the magnitude of the applied was increased, new flexural cracks were observed in the constant
load was increased. The diagonal shear cracks were observed moment (i.e., mid-span) region and were propagated towards
at a total applied load of 320 kN. Once the shear cracks were the compression zone at the top. As compared to the Set-I
initiated, the further increase in the applied loads resulted in the specimens, a relatively higher number of flexural cracks were
widening of these cracks at a much faster rate than the flexural observed in the Set-II specimens at the failure stage. The
(a) (b)
Figure 6: Pattern of cracks observed in test specimens at design load levels: (a) Set-I; (b) Set-II
(a) (b)
Figure 7: Cracking pattern observed at failure loads of test specimens: (a) Set-I; (b) Set-II
(Note: Thick lines represent the major crack at failure)
THE INDIAN CONCRETE JOURNAL | JUNE 2022 21