
Page 7 - February-2022
P. 7
TECHNICAL PAPER
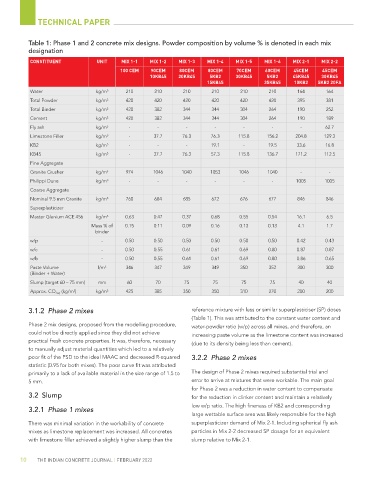
Table 1: Phase 1 and 2 concrete mix designs. Powder composition by volume % is denoted in each mix
designation
CONSTITUENT UNIT MIX 1-1 MIX 1-2 MIX 1-3 MIX 1-4 MIX 1-5 MIX 1-6 MIX 2-1 MIX 2-2
100 CEM 90CEM 80CEM 80CEM 70CEM 60CEM 45CEM 45CEM
10KB45 20KB45 5KB2 30KB45 5KB2 45KB45 30KB45
15KB45 35KB45 10KB2 5KB2 20FA
Water kg/m 3 210 210 210 210 210 210 164 164
Total Powder kg/m 3 420 420 420 420 420 420 395 381
Total Binder kg/m 3 420 382 344 344 304 264 190 252
Cement kg/m 3 420 382 344 344 304 264 190 189
Fly ash kg/m 3 - - - - - - - 62.7
Limestone Filler kg/m 3 - 37.7 76.3 76.3 115.8 156.2 204.8 129.3
KB2 kg/m 3 - - - 19.1 - 19.5 33.6 16.8
KB45 kg/m 3 - 37.7 76.3 57.3 115.8 136.7 171.2 112.5
Fine Aggregate
Granite Crusher kg/m 3 974 1046 1040 1053 1046 1040 - -
Philippi Dune kg/m 3 - - - - - - 1005 1005
Coarse Aggregate
Nominal 9.5 mm Granite kg/m 3 760 684 685 672 676 677 846 846
Superplasticizer
Master Glenium ACE 456 kg/m 3 0.63 0.47 0.37 0.68 0.55 0.54 16.1 6.5
Mass % of 0.15 0.11 0.09 0.16 0.13 0.13 4.1 1.7
binder
w/p - 0.50 0.50 0.50 0.50 0.50 0.50 0.42 0.43
w/c - 0.50 0.55 0.61 0.61 0.69 0.80 0.87 0.87
w/b - 0.50 0.55 0.61 0.61 0.69 0.80 0.86 0.65
Paste Volume l/m 3 346 347 349 349 350 352 300 300
(Binder + Water)
Slump (target 60 – 75 mm) mm 60 70 75 75 75 75 40 40
Approx. CO 2eq (kg/m ) kg/m 3 425 385 350 350 310 270 200 200
3
3.1.2 Phase 2 mixes reference mixture with less or similar superplasticiser (SP) doses
(Table 1). This was attributed to the constant water content and
Phase 2 mix designs, proposed from the modelling procedure, water-powder ratio (w/p) across all mixes, and therefore, an
could not be directly applied since they did not achieve increasing paste volume as the limestone content was increased
practical fresh concrete properties. It was, therefore, necessary
(due to its density being less than cement).
to manually adjust material quantities which led to a relatively
poor fit of the PSD to the ideal MAAC and decreased R-squared 3.2.2 Phase 2 mixes
statistic (0.95 for both mixes). The poor curve fit was attributed
primarily to a lack of available material in the size range of 1.5 to The design of Phase 2 mixes required substantial trial and
5 mm. error to arrive at mixtures that were workable. The main goal
for Phase 2 was a reduction in water content to compensate
3.2 Slump for the reduction in clinker content and maintain a relatively
low w/p ratio. The high fineness of KB2 and corresponding
3.2.1 Phase 1 mixes
large wettable surface area was likely responsible for the high
There was minimal variation in the workability of concrete superplasticizer demand of Mix 2-1. Including spherical fly ash
mixes as limestone replacement was increased. All concretes particles in Mix 2-2 decreased SP dosage for an equivalent
with limestone filler achieved a slightly higher slump than the slump relative to Mix 2-1.
10 THE INDIAN CONCRETE JOURNAL | FEBRUARY 2022