Page 8 - February-2022
P. 8

TECHNICAL PAPER


              0.7                                                   100
                                                                     90
            ensity (-)  0.65                                         80
                                                                     70
                                                                     60
            d                                                      Cumulative percent passing (%)  50
            Packing  0.6                                             30
                                                                     40
                                                                     20

             0.55                                                    10 0 0.1   1       10       100     1000    10000
                0        0.2      0.4      0.6      0.8       1
                                                                                        Particle size (µm)
                               Vol. % CEM II A-L 52.5 N                       MAAC ideal       Mix 1-1     Mix 1-2
                    KB 2   KB 5   KB 10   KB 45  CEM II A-L 52.5 N            grading curve    Mix 1-3     Mix 1-5

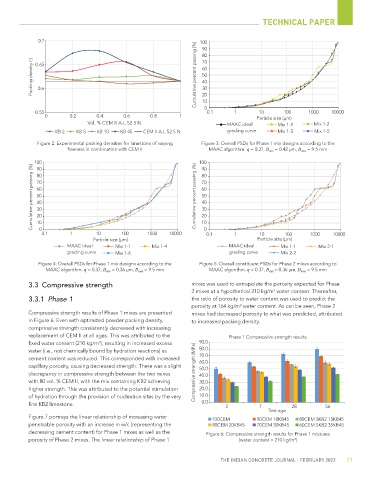
             Figure 2: Experimental packing densities for limestone of varying   Figure 3: Overall PSDs for Phase 1 mix designs according to the
                        fineness in combination with CEM II         100  MAAC algorithm. q = 0.37, D min  = 0.42 µm, D max  = 9.5 mm

            Cumulative percent passing (%) 100                     Cumulative percent passing (%)  80
             90
                                                                     90
             80
                                                                     70
             70
             60
                                                                     60
                                                                     50
             50
             40
                                                                     40
             30
                                                                     30
             20
             10
                                                                     10
              0
               0.1       1       10       100      1000   10000      20 0 0.1   1       10       100      1000   10000
                                Particle size (µm)                                      Particle size (µm)
                        MAAC ideal      Mix 1-1     Mix 1-4                   MAAC ideal        Mix 1-1     Mix 2-1
                        grading curve   Mix 1-6                               grading curve     Mix 2-2
              Figure 4: Overall PSDs for Phase 1 mix designs according to the    Figure 5: Overall constituent PSDs for Phase 2 mixes according to
                MAAC algorithm. q = 0.37, D min  = 0.36 µm, D max  = 9.5 mm  MAAC algorithm. q = 0.37, D min  = 0.36 µm, D max  = 9.5 mm
           3.3  Compressive strength                              mixes was used to extrapolate the porosity expected for Phase
                                                                  2 mixes at a hypothetical 210 kg/m  water content. Thereafter,
                                                                                             3
           3.3.1  Phase 1                                         the ratio of porosity to water content was used to predict the
                                                                  porosity at 164 kg/m  water content. As can be seen, Phase 2
                                                                                  3
           Compressive strength results of Phase 1 mixes are presented   mixes had decreased porosity to what was predicted, attributed
           in Figure 6. Even with optimized powder packing density,   to increased packing density.
           compressive strength consistently decreased with increasing
           replacement of CEM II at all ages. This was attributed to the      Phase 1 Compressive strength results
           fixed water content (210 kg/m ), resulting in increased excess   90.0
                                  3
           water (i.e., not chemically bound by hydration reactions) as   80.0
           cement content was reduced. This corresponded with increased   70.0
           capillary porosity, causing decreased strength. There was a slight   60.0
                                                                    50.0
           discrepancy in compressive strength between the two mixes   Compressive strength (MPa)  40.0
           with 80 vol. % CEM II, with the mix containing KB2 achieving   30.0
           higher strength. This was attributed to the potential stimulation   20.0
           of hydration through the provision of nucleation sites by the very   10.0
           fine KB2 limestone.                                       0.0
                                                                             3          7          28          56
                                                                                           Test age
           Figure 7 portrays the linear relationship of increasing water
                                                                         100CEM         90CEM 10KB45  80CEM 5KB2 15KB45
           penetrable porosity with an increase in w/c (representing the   80CEM 20KB45  70CEM 30KB45  60CEM 5KB2 35KB45
           decreasing cement content) for Phase 1 mixes as well as the   Figure 6: Compressive strength results for Phase 1 mixtures
           porosity of Phase 2 mixes. The linear relationship of Phase 1          (water content = 210 kg/m )
                                                                                                    3

                                                                           THE INDIAN CONCRETE JOURNAL | FEBRUARY 2022  11
   3   4   5   6   7   8   9   10   11