
Page 9 - February-2022
P. 9
TECHNICAL PAPER
Water permeable porosity vs w/c 80.0 8.0
20.0 y = 14.40x + 3.20 70.0 6.9 7.0
18.0 R² = 0.95 trength (MPa) 6.3
16.0 60.0 5.3 5.6 5.5 5.8 5.7 6.0 6.0
Porosity (%) 12.0 s ompressive 50.0 4.0 bi (kg reactive binder / m3 / MPa)
14.0
5.0
40.0
10.0
8.0
6.0 30.0 3.0
4.0 c 20.0 2.0
2.0 10.0 1.0
0.0 28 day
0.40 0.45 0.50 0.55 0.60 0.65 0.70 0.75 0.80 0.85 0.90 0.95 1.00 0.0 0.0
w/c (-) 100CEM 90CEM 80CEM 80CEM 70CEM 60CEM 45 CEM 45 45CEM 30
10KB45 5KB2 20KB45 30KB45 5KB2 KB45 10 KB45 5KB2
Predicted porosity for Phase 2 after correction for water content 15KB45 35KB45 KB2 20FA
Phase 1 Phase 2 Trendline 28 day compressive strength Binder efficiency index (bi)
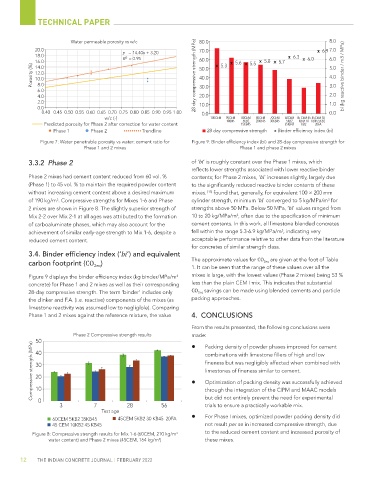
Figure 7: Water penetrable porosity vs water: cement ratio for Figure 9: Binder efficiency index (bi) and 28-day compressive strength for
Phase 1 and 2 mixes Phase 1 and phase 2 mixes
3.3.2 Phase 2 of ‘bi’ is roughly constant over the Phase 1 mixes, which
reflects lower strengths associated with lower reactive binder
Phase 2 mixes had cement content reduced from 60 vol. % contents; for Phase 2 mixes, ‘bi’ increases slightly, largely due
(Phase 1) to 45 vol. % to maintain the required powder content to the significantly reduced reactive binder contents of these
without increasing cement content above a desired maximum mixes. [13] found that, generally, for equivalent 100 × 200 mm
of 190 kg/m . Compressive strengths for Mixes 1-6 and Phase cylinder strength, minimum ‘bi’ converged to 5 kg/MPa/m for
3
3
2 mixes are shown in Figure 8. The slightly superior strength of strengths above 50 MPa. Below 50 MPa, ‘bi’ values ranged from
Mix 2-2 over Mix 2-1 at all ages was attributed to the formation 10 to 20 kg/MPa/m , often due to the specification of minimum
3
of carboaluminate phases, which may also account for the cement contents. In this work, all limestone blended concretes
3
achievement of similar early-age strength to Mix 1-6, despite a fell within the range 5.3-6.9 kg/MPa/m , indicating very
reduced cement content. acceptable performance relative to other data from the literature
for concretes of similar strength class.
3.4. Binder efficiency index (‘bi’) and equivalent
The approximate values for CO 2eq are given at the foot of Table
carbon footprint (CO )
2eq 1. It can be seen that the range of these values over all the
Figure 9 displays the binder efficiency index (kg binder/MPa/m 3 mixes is large, with the lowest values (Phase 2 mixes) being 53 %
concrete) for Phase 1 and 2 mixes as well as their corresponding less than the plain CEM I mix. This indicates that substantial
28-day compressive strength. The term ‘binder’ includes only CO 2eq savings can be made using blended cements and particle
the clinker and F.A. (i.e. reactive) components of the mixes (as packing approaches.
limestone reactivity was assumed low to negligible). Comparing
Phase 1 and 2 mixes against the reference mixture, the value 4. CONCLUSIONS
From the results presented, the following conclusions were
Phase 2 Compressive strength results made:
50 Packing density of powder phases improved for cement
Compressive strength (MPa) 30 fineness but was negligibly affected when combined with
40
combinations with limestone fillers of high and low
limestones of fineness similar to cement.
20
Optimization of packing density was successfully achieved
10
but did not entirely prevent the need for experimental
0
trials to ensure a practically workable mix.
3 7 28 56 through the integration of the CIPM and MAAC models
Test age
For Phase I mixes, optimized powder packing density did
60CEM 5KB2 35KB45 45CEM 5KB2 30 KB45 20FA
45 CEM 10KB2 45 KB45 not result per se in increased compressive strength, due
Figure 8: Compressive strength results for Mix 1-6 (60CEM, 210 kg/m to the reduced cement content and increased porosity of
3
water content) and Phase 2 mixes (45CEM, 164 kg/m ) 3 these mixes.
12 THE INDIAN CONCRETE JOURNAL | FEBRUARY 2022