
Page 9 - Open-Access-February-2020
P. 9
TECHNICAL PAPER
6. ResULts AND DIsCUssION results vulnerable to bias. Secondly, testing the model using a
variety of weighting schemes that favour one impact category or
6.1 eDI Results another can provide valuable information about the sensitivity
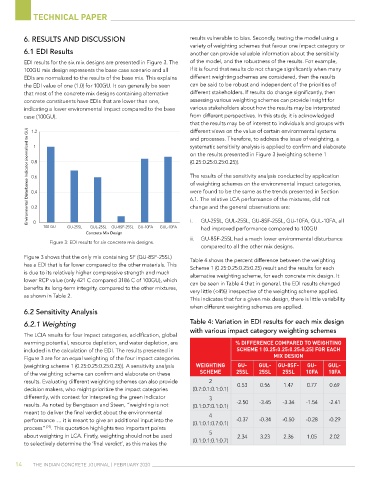
EDI results for the six mix designs are presented in Figure 3. The of the model, and the robustness of the results. For example,
100GU mix design represents the base case scenario and all if it is found that results do not change significantly when many
EDIs are normalized to the results of the base mix. This explains different weighting schemes are considered, then the results
the EDI value of one (1.0) for 100GU. It can generally be seen can be said to be robust and independent of the priorities of
that most of the concrete mix designs containing alternative different stakeholders. If results do change significantly, then
concrete constituents have EDIs that are lower than one, assessing various weighting schemes can provide insight for
indicating a lower environmental impact compared to the base various stakeholders about how the results may be interpreted
case (100GU). from different perspectives. In this study, it is acknowledged
that the results may be of interest to individuals and groups with
different views on the value of certain environmental systems
ÛÀiÌ> ÃÌÕÀL>Vi `V>ÌÀ À>âi` Ì 1® on the results presented in Figure 3 (weighting scheme 1
and processes. Therefore, to address the issue of weighting, a
systematic sensitivity analysis is applied to confirm and elaborate
(0.25:0.25:0.25:0.25)).
The results of the sensitivity analysis conducted by application
of weighting schemes on the environmental impact categories,
were found to be the same as the trends presented in Section
6.1. The relative LCA performance of the mixtures, did not
GU-25SL, GUL-25SL, GU-8SF-25SL, GU-10FA, GUL-10FA, all
i.
)7 change and the general observations are:
had improved performance compared to 100GU
VÀiÌi Ý iÃ}
ii. GU-8SF-25SL had a much lower environmental disturbance
Figure 3: EDI results for six concrete mix designs.
compared to all the other mix designs.
Figure 3 shows that the only mix containing SF (GU-8SF-25SL) Table 4 shows the percent difference between the weighting
has a EDI that is far lower compared to the other materials. This Scheme 1 (0.25:0.25:0.25:0.25) result and the results for each
is due to its relatively higher compressive strength and much alternative weighting scheme, for each concrete mix design. It
lower RCP value (only 421 C compared 3186 C of 100GU), which can be seen in Table 4 that in general, the EDI results changed
benefits its long-term integrity, compared to the other mixtures, very little (<4%) irrespective of the weighting scheme applied.
as shown in Table 2.
This indicates that for a given mix design, there is little variability
when different weighting schemes are applied.
6.2 sensitivity Analysis
6.2.1 Weighting table 4: variation in eDI results for each mix design
with various impact category weighting schemes
The LCIA results for four impact categories, acidification, global
warming potential, resource depletion, and water depletion, are % DIFFERENCE COMpARED TO WEIGhTING
included in the calculation of the EDI. The results presented in SChEME 1 (0.25:0.25:0.25:0.25) FOR EACh
Figure 3 are for an equal weighting of the four impact categories MIX DESIGN
(weighting scheme 1 (0.25:0.25:0.25:0.25)). A sensitivity analysis WEIGhTING Gu- Gul- Gu-8SF- Gu- Gul-
of the weighting scheme can confirm and elaborate on these SChEME 25Sl 25Sl 25Sl 10FA 10FA
results. Evaluating different weighting schemes can also provide 2 0.53 0.56 1.47 0.77 0.69
decision makers, who might prioritize the impact categories (0.7:0.1:0.1:0.1)
differently, with context for interpreting the green indicator 3
results. As noted by Bengtsson and Steen, “weighting is not (0.1:0.7:0.1:0.1) -2.50 -3.45 -3.34 -1.54 -2.41
meant to deliver the final verdict about the environmental 4
performance … it is meant to give an additional input into the (0.1:0.1:0.7:0.1) -0.37 -0.34 -0.50 -0.28 -0.29
process” [27] . This quotation highlights two important points
about weighting in LCA. Firstly, weighting should not be used 5 2.34 3.23 2.36 1.05 2.02
to selectively determine the ‘final verdict’, as this makes the (0.1:0.1:0.1:0.7)
14 The IndIan ConCreTe Journal | FeBruarY 2020