
Page 6 - March-2022
P. 6
TECHNICAL PAPER
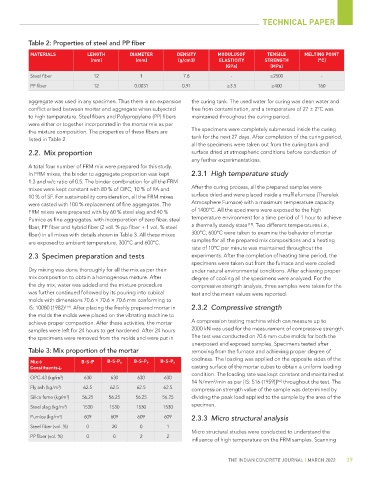
Table 2: Properties of steel and PP fiber
MATERIALS LENGTH DIAMETER DENSITY MODULUS OF TENSILE MELTING POINT
(mm) (mm) (g/cm3) ELASTICITY STRENGTH (°C)
(GPa) (MPa)
Steel fiber 12 1 7.8 - ≥2500 -
PP fiber 12 0.0031 0.91 ≥3.5 ≥400 160
aggregate was used in any specimen. Thus there is no expansion the curing tank. The used water for curing was clean water and
conflict arised between mortar and aggregate when subjected free from contamination, and a temperature of 27 ± 2°C was
to high temperature. Steel fibers and Polypropylene (PP) fibers maintained throughout the curing period.
were either or together incorporated in the mortar mix as per
the mixture composition. The properties of these fibers are The specimens were completely submersed inside the curing
listed in Table 2. tank for the next 27 days. After completion of the curing period,
all the specimens were taken out from the curing tank and
2.2. Mix proportion surface dried at atmospheric conditions before conduction of
any further experimentations.
A total four number of FRM mix were prepared for this study.
In FRM mixes, the binder to aggregate proportion was kept 2.3.1 High temperature study
1:3 and w/c ratio of 0.5. The binder combination for all the FRM
mixes were kept constant with 80 % of OPC, 10 % of FA and After the curing process, all the prepared samples were
10 % of SF. For sustainability consideration, all the FRM mixes surface dried and were placed inside a muffle furnace (Therelek
were casted with 100 % replacement of fine aggregates. The Atmosphere Furnace) with a maximum temperature capacity
FRM mixes were prepared with by 60 % steel slag and 40 % of 1400°C. All the specimens were exposed to the high
Pumice as fine aggregates. with incorporation of zero fiber, steel temperature environment for a time period of 1 hour to achieve
fiber, PP fiber and hybrid fiber (2 vol. % pp fiber + 1 vol. % steel a thermally steady state [15] . Two different temperatures i.e.,
fiber) in all mixes with details shown in Table 3. All these mixes 300°C, 600°C were taken to examine the behavior of mortar
are exposed to ambient temperature, 300°C and 600°C. samples for all the prepared mix compositions and a heating
rate of 10°C per minute was maintained throughout the
2.3 Specimen preparation and tests experiments. After the completion of heating time period, the
specimens were taken out from the furnace and were cooled
Dry mixing was done thoroughly for all the mix as per their under natural environmental conditions. After achieving proper
mix composition to obtain a homogenous mixture. After degree of cooling all the specimens were analyzed. For the
the dry mix, water was added and the mixture procedure compressive strength analysis, three samples were taken for the
was further continued followed by its pouring into cubical test and the mean values were reported.
molds with dimensions 70.6 × 70.6 × 70.6 mm conforming to
IS: 10080 (1982) [14] . After placing the freshly prepared mortar in 2.3.2 Compressive strength
the molds the molds were placed on the vibrating machine to
achieve proper compaction. After these activities, the mortar A compression testing machine which can measure up to
samples were left for 24 hours to get hardened. After 24 hours 2000 kN was used for the measurement of compressive strength.
the specimens were removed from the molds and were put in The test was conducted on 70.6 mm cube molds for both the
unexposed and exposed samples. Specimens tested after
Table 3: Mix proportion of the mortar removing from the furnace and achieving proper degree of
coolness. The loading was applied on the opposite sides of the
Mix→ B-S-P B-S-P S B-S-P P B-S-P H
Constituents↓ casting surface of the mortar cubes to obtain a uniform loading
condition. The loading rate was kept constant and maintained at
OPC-43 (kg/m ) 3 630 630 630 630
14 N/mm /min as per [IS: 516 (1959)] throughout the test. The
[16]
2
Fly ash (kg/m ) 62.5 62.5 62.5 62.5 compression strength value of the sample was determined by
3
Silica fume (kg/m ) 56.25 56.25 56.25 56.25 dividing the peak load applied to the sample by the area of the
3
specimen.
Steel slag (kg/m ) 1530 1530 1530 1530
3
Pumice (kg/m ) 609 609 609 609 2.3.3 Micro structural analysis
3
Steel fiber (vol. %) 0 20 0 1
Micro structural studies were conducted to understand the
PP fiber (vol. %) 0 0 2 2
influence of high temperature on the FRM samples. Scanning
THE INDIAN CONCRETE JOURNAL | MARCH 2022 39