
Page 8 - August-Month
P. 8
TECHNICAL PAPER
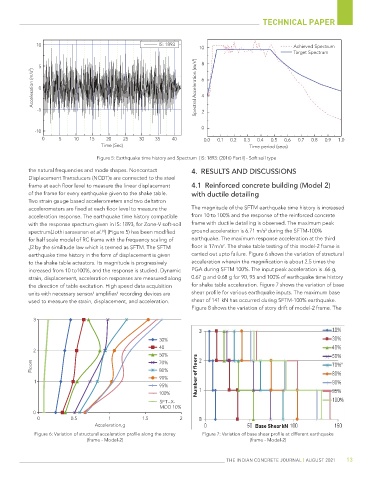
Figure 5: Earthquake time history and Spectrum [IS: 1893: (2016) Part I] - Soft soil type
the natural frequencies and mode shapes. Noncontact 4. RESULTS AND DISCUSSIONS
Displacement Transducers (NCDT)s are connected to the steel
frame at each floor level to measure the linear displacement 4.1 Reinforced concrete building (Model 2)
of the frame for every earthquake given to the shake table. with ductile detailing
Two strain gauge based accelerometers and two deltatron
accelerometers are fixed at each floor level to measure the The magnitude of the SFTM earthquake time history is increased
acceleration response. The earthquake time history compatible from 10 to 100% and the response of the reinforced concrete
with the response spectrum given in IS: 1893, for Zone-V soft-soil frame with ductile detailing is observed. The maximum peak
2
spectrum(Jothi saravanan et al. ) (Figure 5) has been modified ground acceleration is 6.71 m/s during the SFTM-100%
[7]
for half scale model of RC frame with the frequency scaling of earthquake. The maximum response acceleration at the third
2
√2 by the similitude law which is termed as SFTM. The SFTM floor is 17m/s . The shake table testing of this model-2 frame is
earthquake time history in the form of displacement is given carried out upto failure. Figure 6 shows the variation of structural
to the shake table actuators. Its magnitude is progressively acceleration wherein the magnification is about 2.5 times the
increased from 10 to100%, and the response is studied. Dynamic PGA during SFTM 100%. The input peak acceleration is .66 g,
strain, displacement, acceleration responses are measured along 0.67 g and 0.68 g for 90, 95 and 100% of earthquake time history
the direction of table excitation. High speed data acquisition for shake table acceleration. Figure 7 shows the variation of base
units with necessary sensor/ amplifier/ recording devices are shear profile for various earthquake inputs. The maximum base
used to measure the strain, displacement, and acceleration. shear of 141 kN has occurred during SFTM-100% earthquake.
Figure 8 shows the variation of story drift of model-2 frame. The
Figure 6: Variation of structural acceleration profile along the storey Figure 7: Variation of base shear profile at different earthquake
(frame - Model-2) (frame - Model-2)
THE INDIAN CONCRETE JOURNAL | AUGUST 2021 13