
Page 10 - August-Month
P. 10
TECHNICAL PAPER
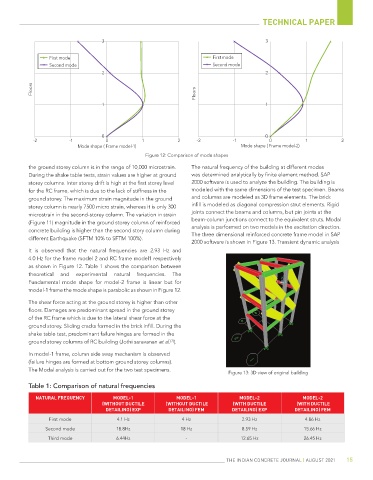
Figure 12: Comparison of mode shapes
the ground storey column is in the range of 10,000 microstrain. The natural frequency of the building at different modes
During the shake table tests, strain values are higher at ground was determined analytically by finite element method. SAP
storey columns. Inter storey drift is high at the first storey level 2000 software is used to analyze the building. The building is
for the RC frame, which is due to the lack of stiffness in the modeled with the same dimensions of the test specimen. Beams
ground storey. The maximum strain magnitude in the ground and columns are modeled as 3D frame elements. The brick
storey column is nearly 7500 micro strain, whereas it is only 300 infill is modeled as diagonal compression strut elements. Rigid
microstrain in the second-storey column. The variation in strain joints connect the beams and columns, but pin joints at the
(Figure 11) magnitude in the ground storey column of reinforced beam-column junctions connect to the equivalent struts. Modal
concrete building is higher than the second story column during analysis is performed on two models in the excitation direction.
different Earthquake (SFTM 10% to SFTM 100%). The three dimensional reinforced concrete frame model in SAP
2000 software is shown in Figure 13. Transient dynamic analysis
It is observed that the natural frequencies are 2.93 Hz and
4.0 Hz for the frame model 2 and RC frame model1 respectively
as shown in Figure 12. Table 1 shows the comparison between
theoretical and experimental natural frequencies. The
Fundamental mode shape for model-2 frame is linear but for
model-1 frame the mode shape is parabolic as shown in Figure 12.
The shear force acting at the ground storey is higher than other
floors. Damages are predominant spread in the ground storey
of the RC frame which is due to the lateral shear force at the
ground storey. Sliding cracks formed in the brick infill. During the
shake table test, predominant failure hinges are formed in the
ground storey columns of RC building (Jothi saravanan et al. ).
[7]
In model-1 frame, column side sway mechanism is observed
(failure hinges are formed at bottom ground storey columns).
The Modal analysis is carried out for the two test specimens.
Figure 13: 3D view of original building
Table 1: Comparison of natural frequencies
NATURAL FREQUENCY MODEL-1 MODEL-1 MODEL-2 MODEL-2
(WITHOUT DUCTILE (WITHOUT DUCTILE (WITH DUCTILE (WITH DUCTILE
DETAILING) EXP DETAILING) FEM DETAILING) EXP DETAILING) FEM
First mode 4.1 Hz 4 Hz 2.93 Hz 4.86 Hz
Second mode 18.8Hz 18 Hz 8.59 Hz 15.66 Hz
Third mode 6.44Hz - 12.65 Hz 26.45 Hz
THE INDIAN CONCRETE JOURNAL | AUGUST 2021 15